SLOs, incidents and DORA
You don't have to set up monitoring to know whether a Product is healthy. Every Product with environments gets objectives, alerts and a status page from the moment it is deployed, and Infrared shows them where you already look:
- On each Product's card on Products: production's SLOs, the worst first.
- At the top of Products, in This week: DORA across every Product and production uptime, and under the cards, the incidents still open.
- On a Product's page, on its Environments tab under the tiles: its DORA metrics for the last 30 days, its SLOs with their error budgets, and its Incidents.
- On each environment: its uptime over 30 days on its tile, and its part of the status page on its page's History tab (Environments).
- On a deployment: the release guard reads the same SLOs while it holds each environment, and rolls back a deployment that burns its error budget.
When an objective is at risk, an alert opens an incident for you, and the Product's card tells you before you go looking.
SLOs
Every Product with environments gets a default uptime SLO: 99.5% of the last 7 days with at least one ready pod, in every environment. It reads kube-state-metrics, so it needs nothing from your app. It is recorded everywhere, but its burn-rate and zone-down alerts fire only in production, since pre-production restarts with every deployment. To change it, define your own SLO named uptime.
Where the install's edge is the Gateway (Envoy), every Product with environments also gets two SLOs read from Envoy's own metrics for its routes, which also need nothing from the app:
- edge-errors: 99.5% of requests answered without a 5xx, over 7 days.
- edge-latency: 99% of requests answered within a second, over 7 days.
Like uptime, they are recorded everywhere and alert only in production. Define your own SLO of the same name, with the edgeErrors or edgeLatency indicator, to change its objective or to have it alert in pre-production too. Grafana's Infrared zones: requests at the edge dashboard shows the same metrics per zone: requests per second, the share of 5xx, and p95 latency.
Add your own objectives under Product settings → Service level objectives, or in the Product's spec.slos; both set the same field. Each one counts good and bad events with exactly one indicator (availability, latency, uptime, edgeErrors or edgeLatency), over a window (7 days by default), in the zones you name (every zone by default).
spec:
  slos:
    - name: availability
      description: Requests that don't fail with a 5xx.
      objective: "99.5"            # percent of good events
      window: 168h                 # must fit in the metrics retention (14 days by default)
      indicator:
        availability:
          metric: http_requests_total     # a request counter
          errors: code=~"5.."             # the default
          filter: route!="/metrics"       # optional label matchers
    - name: latency
      description: Requests answered within 250 ms.
      objective: "99"
      indicator:
        latency:
          histogram: http_request_duration_seconds   # _bucket and _count are read
          threshold: "0.25"                          # must be one of the histogram's le buckets
    - name: edge-latency                             # replaces the default
      objective: "99"
      zones: [shop-prod]
      indicator:
        edgeLatency:
          thresholdMS: "500"                         # one of Envoy's buckets: 5, 10, 25, 50, 100, 250, 500, 1000 ... 60000
Infrared keeps one VMRule per Product, infrared-slo-<product>, in the org's namespace. For each SLO in each of its zones it holds:
- recording rules for the error ratio over 5m, 30m, 1h, 6h and the window (
infrared:slo_errors:ratio_*); - a fast burn alert (
InfraredSLOFastBurn, critical): the 1-hour and 5-minute error ratios above 14.4 times the budget for 2 minutes, a pace that would spend the whole budget in about a fourteenth of the window; - a slow burn alert (
InfraredSLOSlowBurn, warning): the 6-hour and 30-minute ratios above 6 times the budget for 15 minutes.
Each zone an SLO covers also gets a zone down alert (InfraredZoneDown, critical): no available pods for 3 minutes.
Infrared's own platform Product gets the same default SLOs for its control plane, read from the namespace Infrared runs in. They are recorded and never alert.
The Product's status says whether its rules are in place (status.observability). The SLOs table on the Product's page has one row per SLO and zone: the objective and window, the attainment, how much error budget is left, the burn rates over 1 and 6 hours, and a state: Meeting objective, Burning budget (a burn rate above 1), Budget spent, or No traffic yet.
Alerts open incidents
You don't open incidents for the problems Infrared can see: it does that for you. Infrared routes the org's alerts from Alertmanager to its API (a VMAlertmanagerConfig named infrared-incidents in the org's namespace, posting to /v1/webhooks/alertmanager/<org> with the token in the Secret infrared-alert-webhook). A firing alert opens an incident: one per alert, with its severity, zone, the alert's labels and a link to the rule in vmalert. When the alert stops firing, Infrared notes it on the timeline and resolves the incident.
The Incidents list on the Product's page shows its incidents, open ones first: severity (Critical, Warning or Info), title, zone, state (Open, Acknowledged or Resolved), the alert it came from (or "opened by hand") and when it opened.
On an incident's page, Acknowledge it to say you're on it, write in Note and choose Add note as you work, and Resolve it, with a note on what fixed it if you like. Everything lands on the incident's Timeline, with who did it.
Open an incident, on the Product's page, records something no alert caught: a Title, a Severity (critical, warning or info), a Zone or Not zone-specific, and What you see.
DORA metrics
Infrared computes the four DORA metrics for the last 30 days from the Product's deployments, Changes and incidents, and rates each Elite, High, Medium or Low (or No data yet). They are on the Product's page, and folded across every Product in the strip at the top of Products: deploy rates add up, a failure rate counts failures over every deployment, and a lead time or time to restore weighs each Product by its deployments. The line under each figure there says how many Products sit at each rating.
| Metric | How Infrared measures it |
|---|---|
| Deployment frequency | Deployments that reached a production zone Healthy. |
| Lead time for changes | Median time from a Change's merge (or a deployment's start, when it was started by hand) to running Healthy in a production zone. |
| Change failure rate | Deployments to a production zone that failed to promote, or were followed by a warning or critical incident there within 24 hours. |
| Time to restore service | Median time from opening to resolving the Product's warning and critical incidents. |
Status page
Every Product has a status page at /status/<org>/<product>, so the people who use your app can see how it is doing without asking. Status page at the foot of each environment's tile opens it.
- Zones. Each zone shown, with its state and the version it runs: Operational, Degraded (an SLO there is burning or has spent its budget, or a warning incident is open) or Down (a critical incident is open). The badge at the top is the worst of them. Under each zone, a bar per day for the last 30 days shows the share of the day it had a ready pod: green from 99.9%, a lighter green from 99%, amber from 95%, red below, and grey without data. Hover a day for its figure; the overall share sits under the bar.
- Objectives. Each SLO in the zones shown, with its attainment against the objective, for example
99.999% of 99.5%. The default SLOs are included. - Incidents. Open incidents, and those resolved in the last 14 days, each with its severity, state and updates. Updates leave out who did what. With none, the page says "No incidents in the last 14 days."
The footer says when the page was updated (it refreshes every 30 seconds) and whether it's public. A signed-in visitor also gets Back to <Product> in Infrared at the top; a public visitor sees only the status.
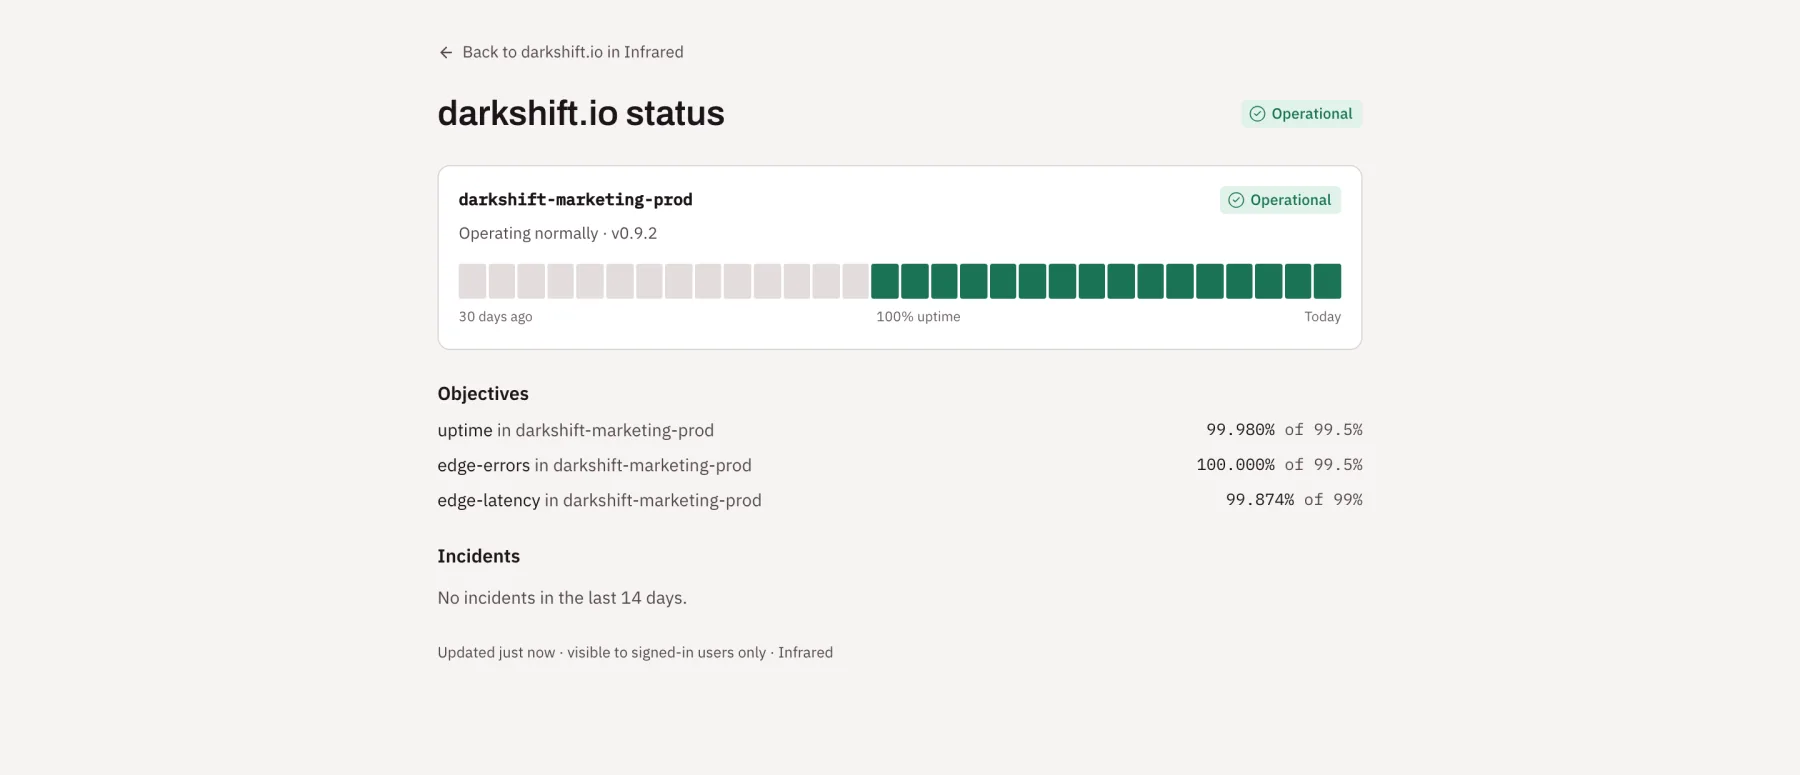
People signed in to Infrared can always see it. To show it to anyone, turn on Anyone can read the status page under Product settings → Status page, where Zones shown picks its zones, or set the same in the spec:
spec:
  statusPage:
    public: true
    zones: [checkout-prod]     # default: the production zones
API
| Endpoint | What it returns |
|---|---|
GET /v1/orgs/{org}/products/{name}/slos | Each SLO in each zone: attainment, budget left, burn rates, state (ok, burning, exhausted, no-data). |
GET /v1/orgs/{org}/products/{name}/dora?days=30 | The four DORA metrics and ratings, over 1 to 365 days. |
GET /v1/orgs/{org}/incidents?product={name}&open=true | Incidents, open first. GET .../incidents/{name} for one. |
POST /v1/orgs/{org}/incidents | Open an incident by hand: product, zone, severity, title, description. |
POST /v1/orgs/{org}/incidents/{name}/acknowledge, .../resolve, .../notes | The incident's lifecycle. Each takes a message; a note needs one. |
GET /v1/orgs/{org}/products/{name}/status | The status page as signed-in people see it, published or not. |
GET /v1/status/{org}/{product} | The public status page, without signing in; 404 unless spec.statusPage.public is true. |